

Personal Reports
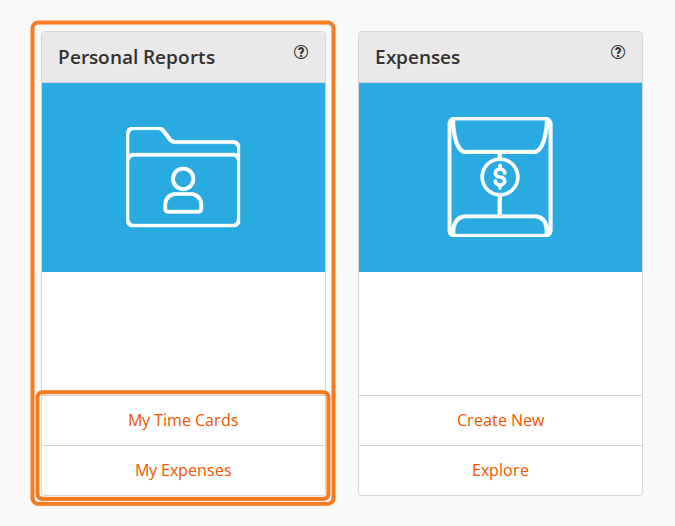
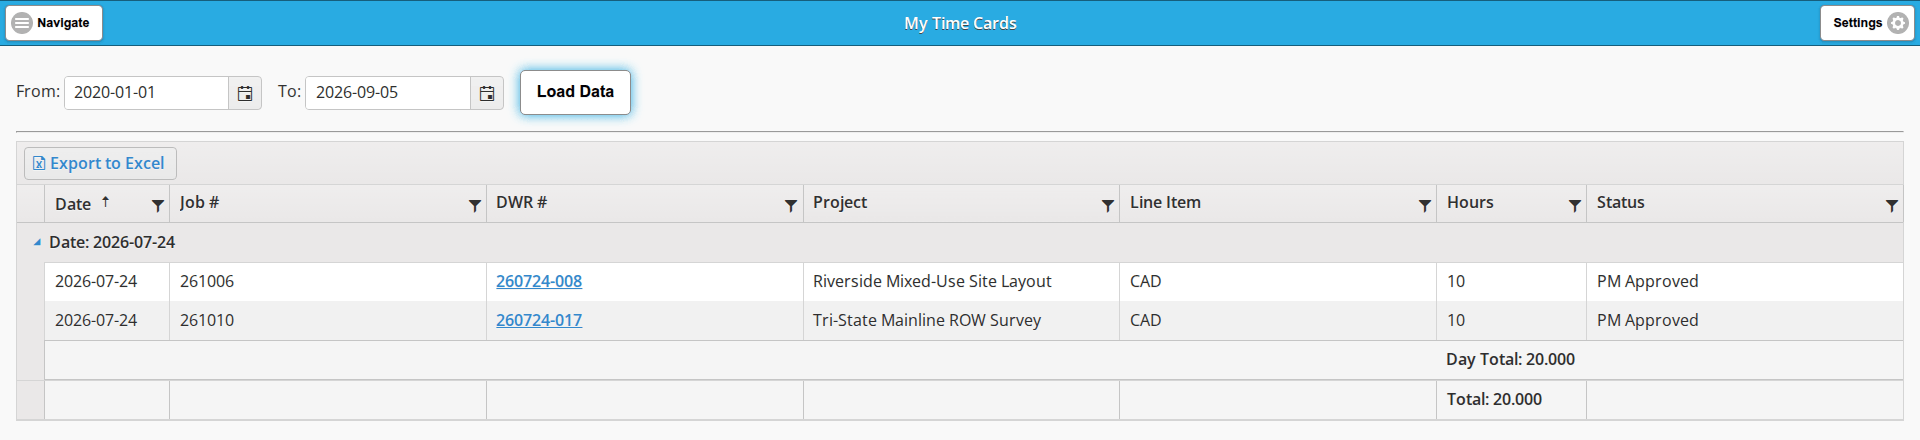
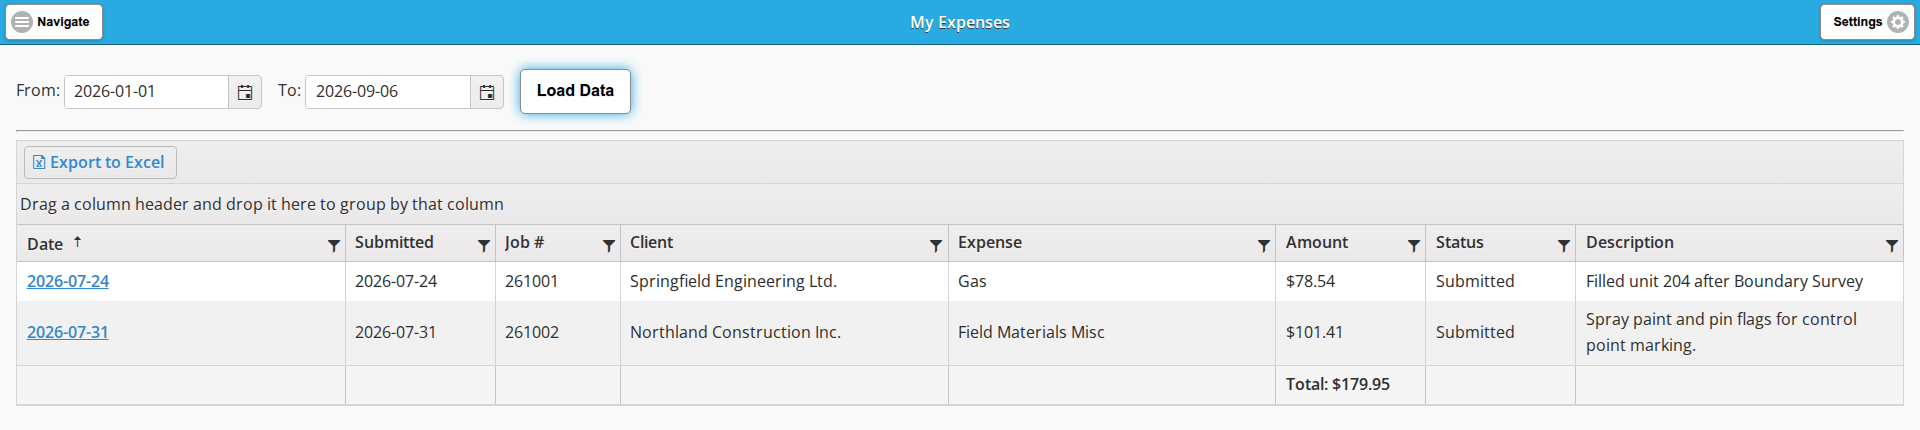
The two reports on the Personal Reports card: My Time Cards, one row per labour line with a Day Total, and My Expenses, one row per expense with a Total.
Key Concepts
The Personal Reports card on the dashboard holds the reports about your own work: My Time Cards, which lists the hours entered against your name, and My Expenses, which lists the expenses you filed. Both are read-only, so nothing you do on these screens changes a record. Every role has the card.
To open one, on the dashboard, in the Personal Reports card, click My Time Cards or My Expenses.
The two screens share the same controls:
- From: and To: set the date range. Both reports open with a range already filled in and an empty grid; click Load Data to fill it.
- The range they open on is short, the two weeks ending today. Widen From: before you click Load Data if you want older work.
- Export to Excel downloads what is in the grid.
- Every column header carries a funnel filter icon, and the grid opens sorted by Date. The funnel opens the same Filter panel, with the same operators, that the Report Grids reach through their column menu. Neither report has a column menu or a template toolbar, so there is no Columns checklist and no layout to save.
My Time Cards
My Time Cards shows the labour hours recorded against you.
There is one row for every labour line on a Daily Work Record, so a day worked on two jobs is two rows. The columns are Date, Job #, DWR #, Project, Line Item, Hours and Status.
Rows are grouped by day, and that grouping is fixed: there is no grouping bar. Each day carries a Date: group header you can collapse, and a Day Total of that day’s hours; a Total of every hour in the range sits at the foot of the grid. The DWR # cell is a link rather than plain text.
Status is the status of the Daily Work Record the line came from, so a row reading PM Approved is time the job’s project manager has already approved.
To see how the hours get here in the first place, see DWR Entry.
My Expenses
My Expenses shows the expenses you filed and where each one has got to.
There is one row per expense, with the columns Date, Submitted, Job #, Client, Expense, Amount, Status and Description. A Total: $ of the Amount column sits at the foot of the grid, so you can read what you spent in a period without exporting anything. The Date cell is a link rather than plain text.
Status is the fastest way to check a reimbursement. Submitted means you have sent the expense in and it is waiting to be approved.
Above the column headers this report carries a grouping bar reading “Drag a column header and drop it here to group by that column”. Dropping the Client header there, for example, groups the rows by client, and clicking a second column header adds a sort inside the first. Grouping on Report Grids describes the bar in full.
To see how an expense is filed, see Expense Entry.
Last updated