

Report Grids
How to sort, filter, choose columns, group, save a layout as a template and export to Excel on the report grid shared by the dashboards, the company reports and Job Explorer.
Key Concepts
Nine screens in Job Book show their rows in the same grid, with the same toolbar above it and the same ⋮ column menu in every column header. Learn it on one screen and you know it on the others. This page describes the grid. The page for each screen describes that screen’s columns and what its rows mean, and says which parts of the grid the screen has.

From left to right and top to bottom:
- Export to Excel: downloads what the grid is showing as an Excel file.
- template toolbar: Select Template…, Reset, Delete, Load, Save and Save As. It remembers a layout so you can come straight back to it.
- the count: at the right of the toolbar, reading “Showing 12 of 12 jobs” above. The first number is the rows on screen after your filters and the second is the rows the grid holds, so the count is how you confirm a filter took effect. Each screen names its rows: jobs, tasks, assets, records, expenses, employees or leave requests.
- grouping bar: the strip reading “Drag a column header and drop it here to group by that column”.
- column header: click it to sort. The ⋮ at its right edge opens the column menu: Sort Ascending, Sort Descending, Columns and Filter.
Where you will find it
- Active Job Dashboard
- Task Dashboard
- Asset Management
- Job Explorer, on the Locations tab
- Line Item Report
- Time Card Report
- Expense Report
- Utilization Report
- Leave Request Report
Some other screens have part of the grid. My Expenses, Invoice Export and the three reports on a job have the grouping bar and Export to Excel but no template toolbar, so there is nothing to save on them. A funnel in each column header opens the same Filter panel the column menu does. The Jobs tab of Job Explorer has the grouping bar and Export to Excel and no filters at all; its filtering is the Filters dialog above the tabs. My Time Cards, the Time Grid and the WIP Report have Export to Excel and the funnel in each header, with no grouping bar and no template toolbar. Their own pages say what they carry. The backlogs share a grid of their own, built around ticking rows and a batch button; see Backlog Grids.
What differs from screen to screen
Every one of them has Export to Excel, the template toolbar, header-click sorting and the Columns checklist. The rest varies:
| Screen | Grouping bar | Filter in the column menu | Clicking a second header | Drag a header to move it |
|---|---|---|---|---|
| Active Job Dashboard | Yes | Yes | Adds a sort | Yes |
| Task Dashboard | Yes | Yes | Adds a sort | Yes |
| Asset Management | Yes | Yes, and a filter row | Replaces the sort | Yes |
| Job Explorer, Locations tab | Yes | No, use the Filters dialog | Adds a sort | Yes |
| Line Item Report | Yes | Yes | Adds a sort | No |
| Time Card Report | Yes | Yes | Adds a sort | No |
| Expense Report | Yes | Yes | Adds a sort | No |
| Utilization Report | No | Yes | Replaces the sort | No |
| Leave Request Report | No | Yes, a shorter list | Replaces the sort | No |
The Leave Request Report is also the only one that pages: it shows 100 rows at a time to start with, and the paging bar across the foot offers other page sizes. The others show every row.
Performing Common Tasks
Sorting
Click a column header to sort the grid by that column. An arrow appears in the header. Click again and the sort reverses. Click a third time and the column is unsorted again. Sort Ascending and Sort Descending in the column menu do the same without the cycling.
What happens when you click a second header depends on the screen, as the table under Key Concepts says: on most of the nine the first sort stays and the second is added inside it, and on the other three the second click replaces the first. Sort the Active Job Dashboard by Project Manager and then by Status, and each project manager’s jobs are in status order. The order you click the headers is the order the sorts apply.

The Line Item, Time Card and Expense reports open already sorted by more than one column. Clicking a header there changes only that column and leaves the rest. Nothing puts the opening order back short of reopening the report from the dashboard: Reset on the template toolbar stays greyed out until you load a template.
Filtering
Open the column menu on the column you want to narrow and hover over Filter. The panel reads “Show items with value that:” and holds an operator dropdown, a box for the value, an And / Or choice, a second operator and value, and the Filter and Clear buttons.
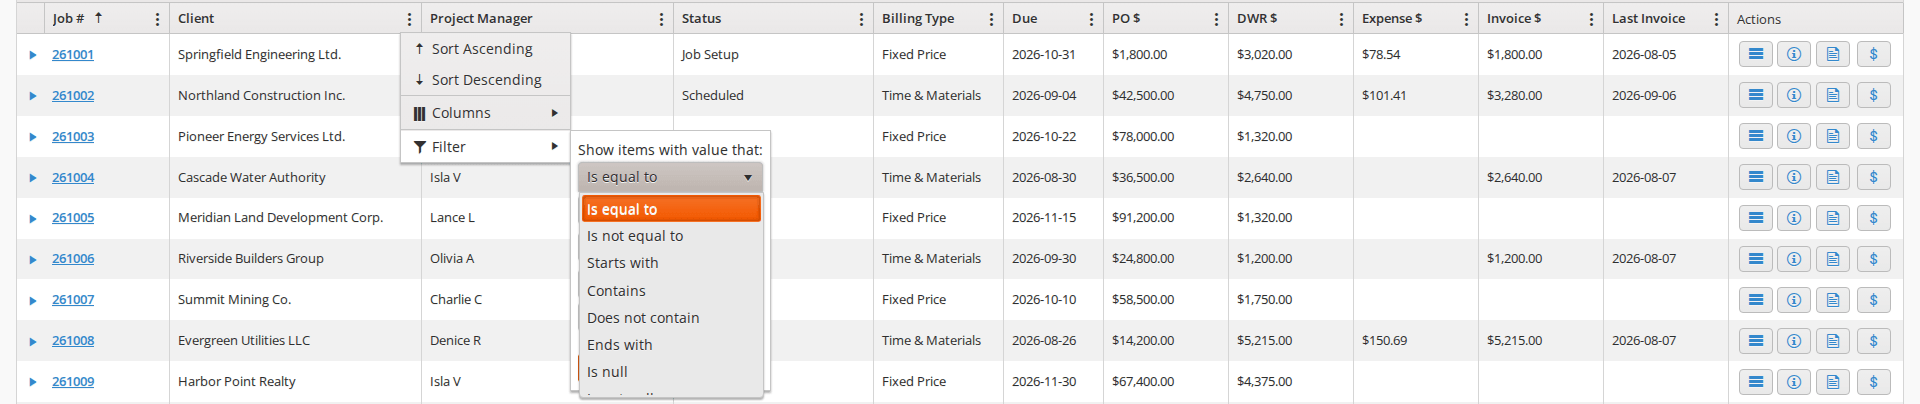
Choose an operator, type the value, and click Filter. To take the filter off, open the same panel and click Clear.
The operators depend on what the column holds:
- Text columns: Is equal to, Is not equal to, Starts with, Contains, Does not contain, Ends with, Is null, Is not null, Is empty, Is not empty, Has no value and Has value. Contains is the forgiving one; Is equal to needs the whole value, spelt as the grid shows it.
- Date columns: Is equal to, Is not equal to, Is after or equal to, Is after, Is before or equal to, Is before, Is null and Is not null, with a date picker for the value.
- Number columns: Is equal to, Is not equal to, Is greater than or equal to, Is greater than, Is less than or equal to, Is less than, Is null and Is not null, with a number box for the value.
A second condition goes in the lower half of the panel, joined to the first with And or Or. Status Is equal to Scheduled Or Is equal to Processing shows both. Filters on different columns always combine with And: a filter on Client and a filter on Status shows only the rows that pass both.
Some screens filter a little differently:
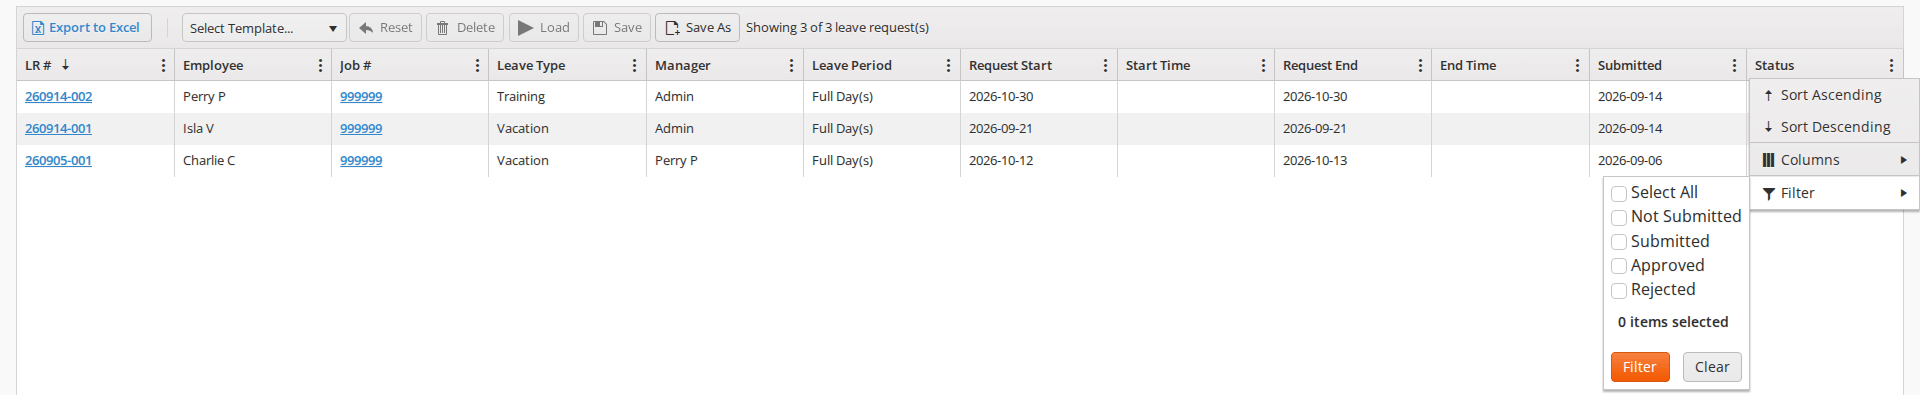
- Leave Request Report: the text columns offer only Starts with, Contains, Is equal to, Is not equal to, Has no value and Has value. The Status and Leave Period columns show a checklist instead of operators: tick the values you want and click Filter. The Status column of the Task Dashboard filters with the same kind of checklist.
- Asset Management: as well as the column menu, a filter row sits under the column headers. Type in a box and the grid narrows to the rows containing what you typed. See Managing assets in the grid.
- Job Explorer, Locations tab: the column menu has no Filter. Use the Filters dialog above the tabs, described on Job Maps.

Choosing columns
Open any column menu and hover over Columns for a checklist of every column the grid can show. Ticked columns are on screen. Untick one and it disappears; tick it and it comes back. The checklist is the same whichever column’s menu you open it from.
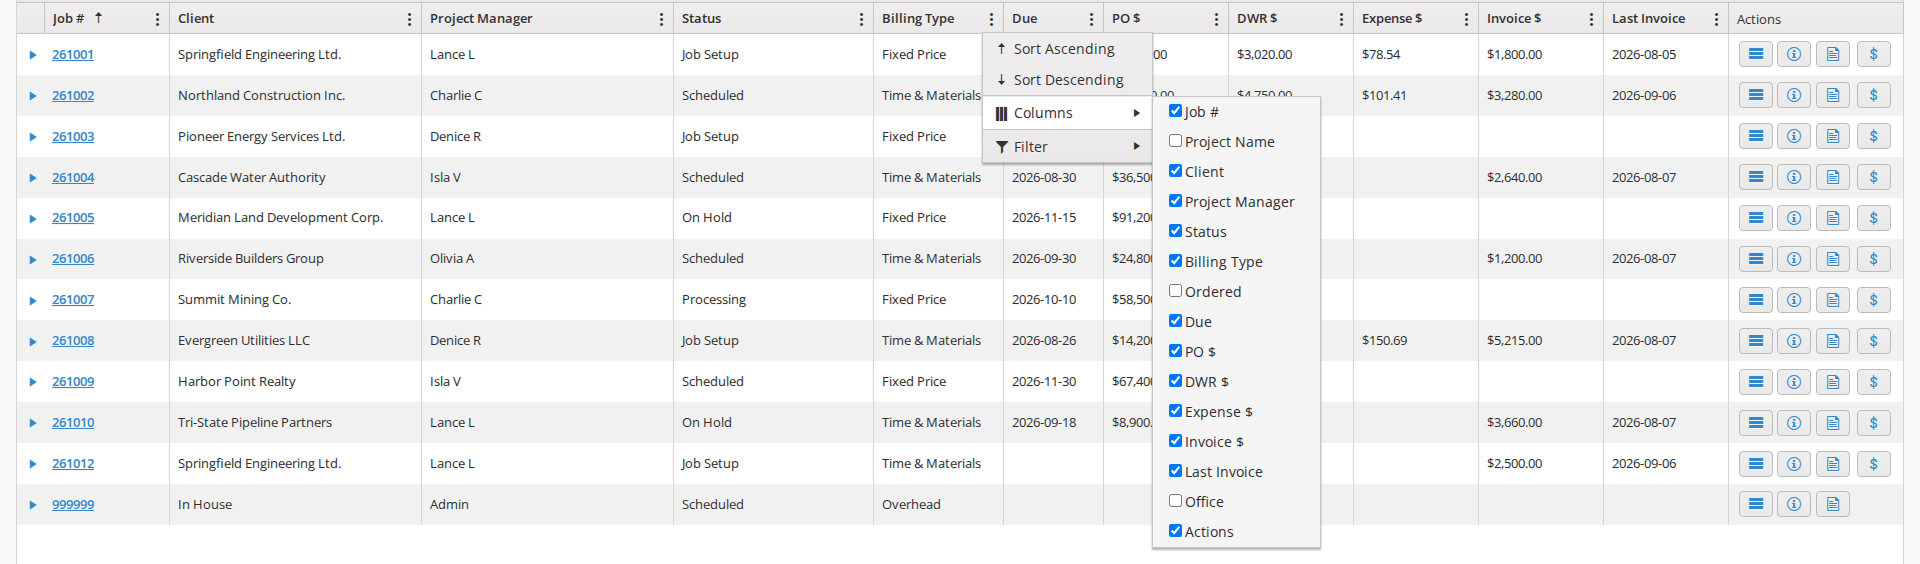
Some screens keep columns hidden until you tick them; each screen’s page says which.
To change a column’s width, drag the edge of its header. On the Active Job Dashboard, the Task Dashboard, Asset Management and Job Explorer you can also drag a header left or right to move the column; the reports keep their columns in a fixed order. The Time Card Report’s columns cannot be resized either.
Grouping
Drag a column header onto the grouping bar and the rows are gathered under one heading per value, each heading reading the column name and the value, such as “Project Manager: Lance L”. Click the triangle at the left of a heading to collapse or expand that group. The header you dragged becomes a chip on the grouping bar, with an arrow to sort the groups and a × to take the grouping off. Where the grid has a totals row, each group gets a subtotal row of its own under its last row.
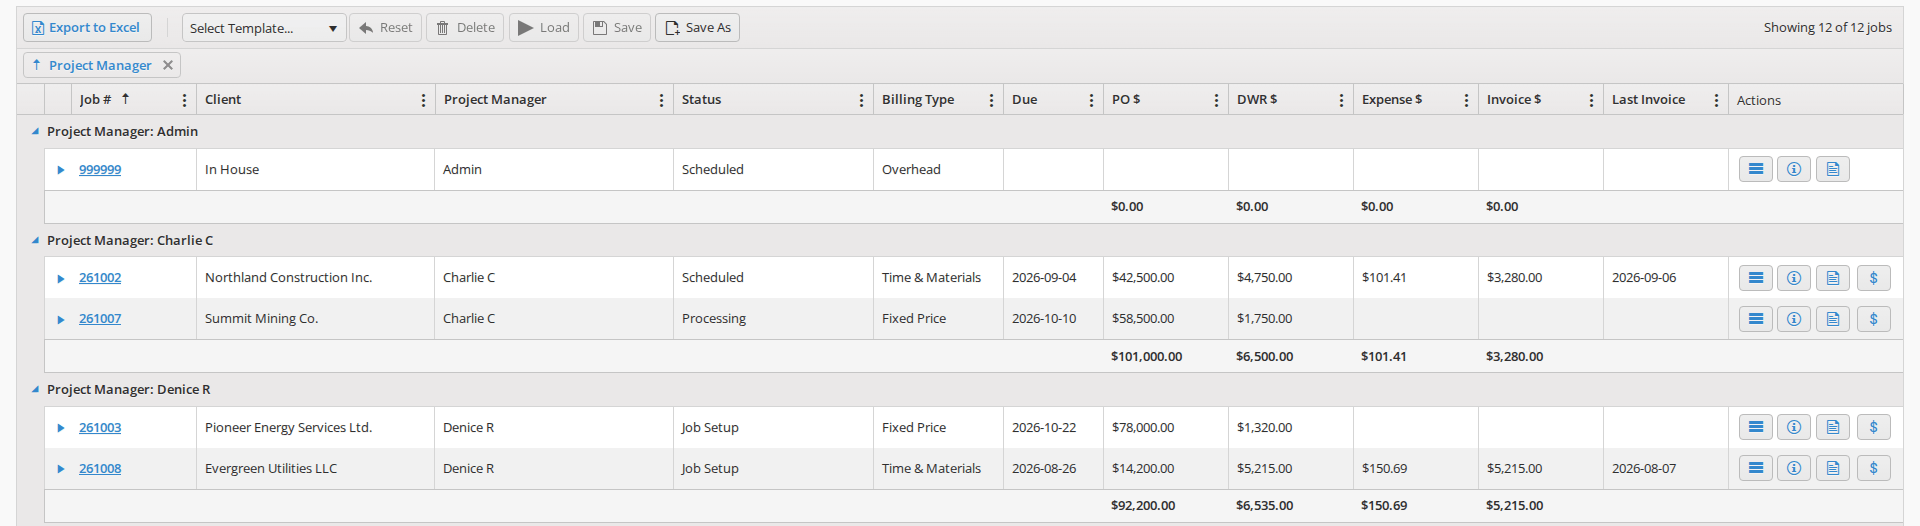
Drop a second header onto the bar to group within groups. Grouped by Project Manager and then Status, each project manager’s group holds one sub-group per status.
Saving a layout as a template
Once the columns, filters, sort and grouping are the way you want them, a template keeps that layout so you do not have to build it again. A template remembers:
- which columns are shown and hidden, their order and their widths;
- the filters in force;
- the sort, including a sort on more than one column;
- the grouping.
The template toolbar sits beside Export to Excel. Reset, Delete, Load and Save are greyed out until you choose a template from Select Template…, so on a screen with no templates yet Save As is the only one you can click.
- Save As: saves the current layout as a new template. A prompt asks “Please enter a template name:”; type a name and click OK.
- Select Template…: choose one of your saved templates.
- Load: applies the selected template. The screen also opens with that template from then on, until you click Reset or load another.
- Save: overwrites the selected template with the current layout. It asks first: “Are you sure that you want to replace the template ‘Name’?”
- Delete: removes the selected template, after asking “Are you sure that you want to delete the template ‘Name’?”
- Reset: puts the grid back to the layout it opens with by default, and stops any template loading on its own.
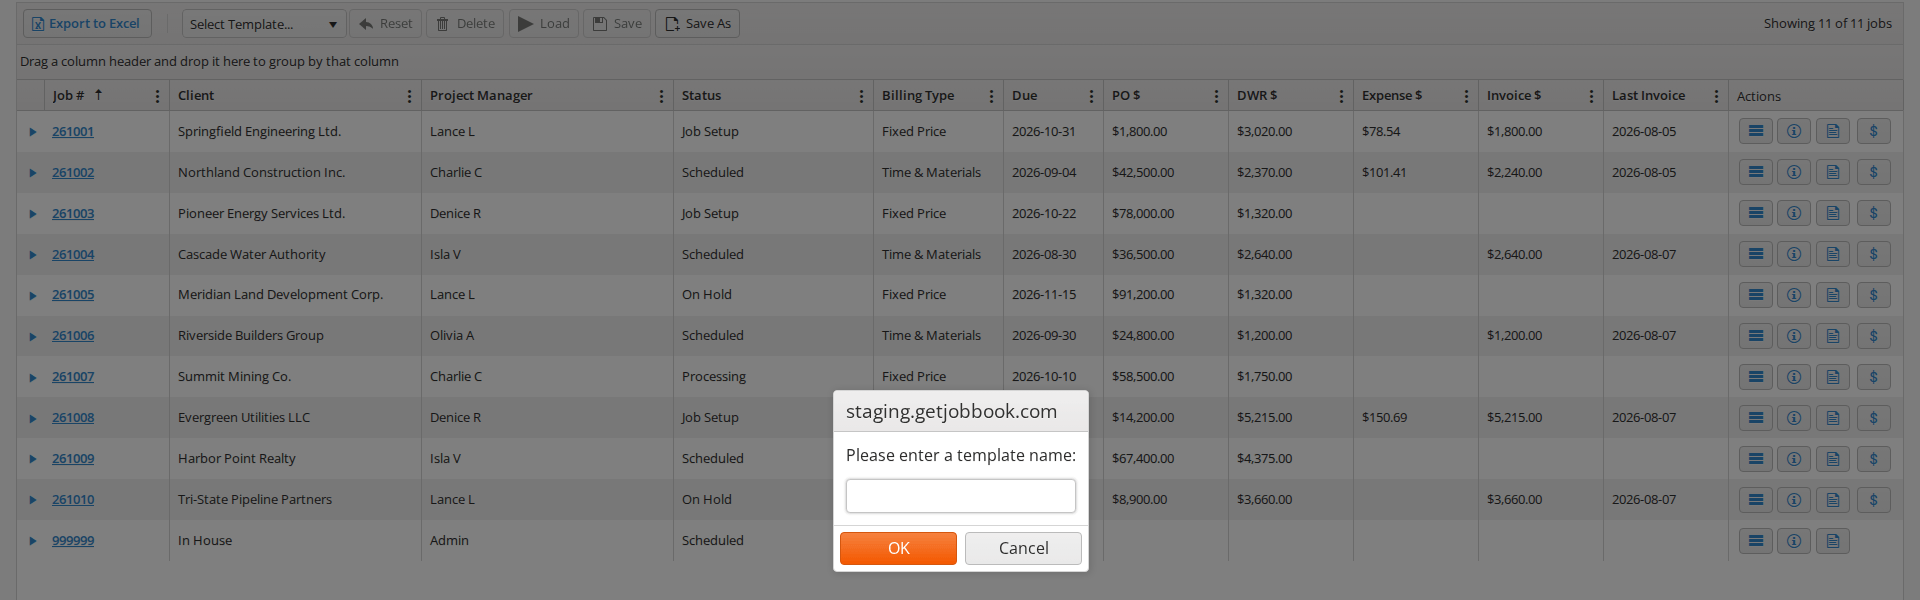
Templates are kept in your browser on the computer you saved them on. Nobody else sees them, they do not follow you to another computer, and clearing the browser’s stored data removes them. Each screen keeps its own set, so a template saved on the Task Dashboard does not appear on the Active Job Dashboard. Template names ignore capitalization: saving “Overdue” when you already have “overdue” replaces it.
Exporting to Excel
Export to Excel is at the left of the toolbar. Clicking it downloads a file named Export.xlsx holding what the grid is showing: only the columns on screen, only the rows that pass your filters, in the current sort order, with the totals row where the grid has one. Hide the columns you do not need and filter before you export, so the spreadsheet holds only what you want.
Last updated