

Time and Expense Reports
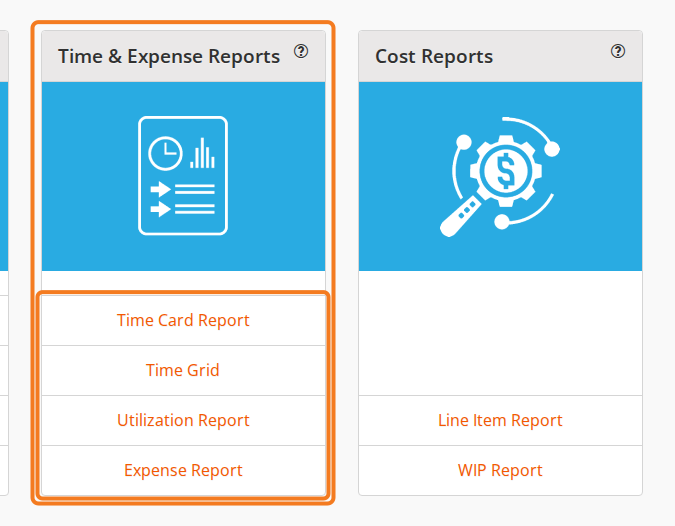
The company reports on the Time & Expense Reports card: the Time Card Report, the Time Grid, the Utilization Report and the Expense Report.
Key Concepts
The Time & Expense Reports card on the dashboard holds the company-wide reports on time and expenses: labour hours, utilization and expense claims. They read the labour hours and expenses your staff have already entered, so nothing you do on these screens changes a record. The card is on the Manager’s and the Administrator’s dashboard only; see Report Access. What the hours behind these reports do for a surveying business is on the Time Sheets product page.
To open one, on the dashboard, in the Time & Expense Reports card, click Time Card Report, Time Grid, Utilization Report or Expense Report.
They all work the same way to start with:
- From and To set the date range, and every report opens with a range already filled in and an empty grid. Click Load Data to fill it.
- The range a report opens on is short: a week for the Time Grid and the Utilization Report, two weeks for the Time Card Report and the Expense Report, both ending today. Widen From before you click Load Data if you want older work.
- Export to Excel downloads what is in the grid.
Three of the four (the Time Card Report, the Utilization Report and the Expense Report) use the report grid described on Report Grids, with its template toolbar and ⋮ column menu. The Time Grid has a funnel filter icon in each column header instead of the column menu, and no template toolbar.
Time Card Report
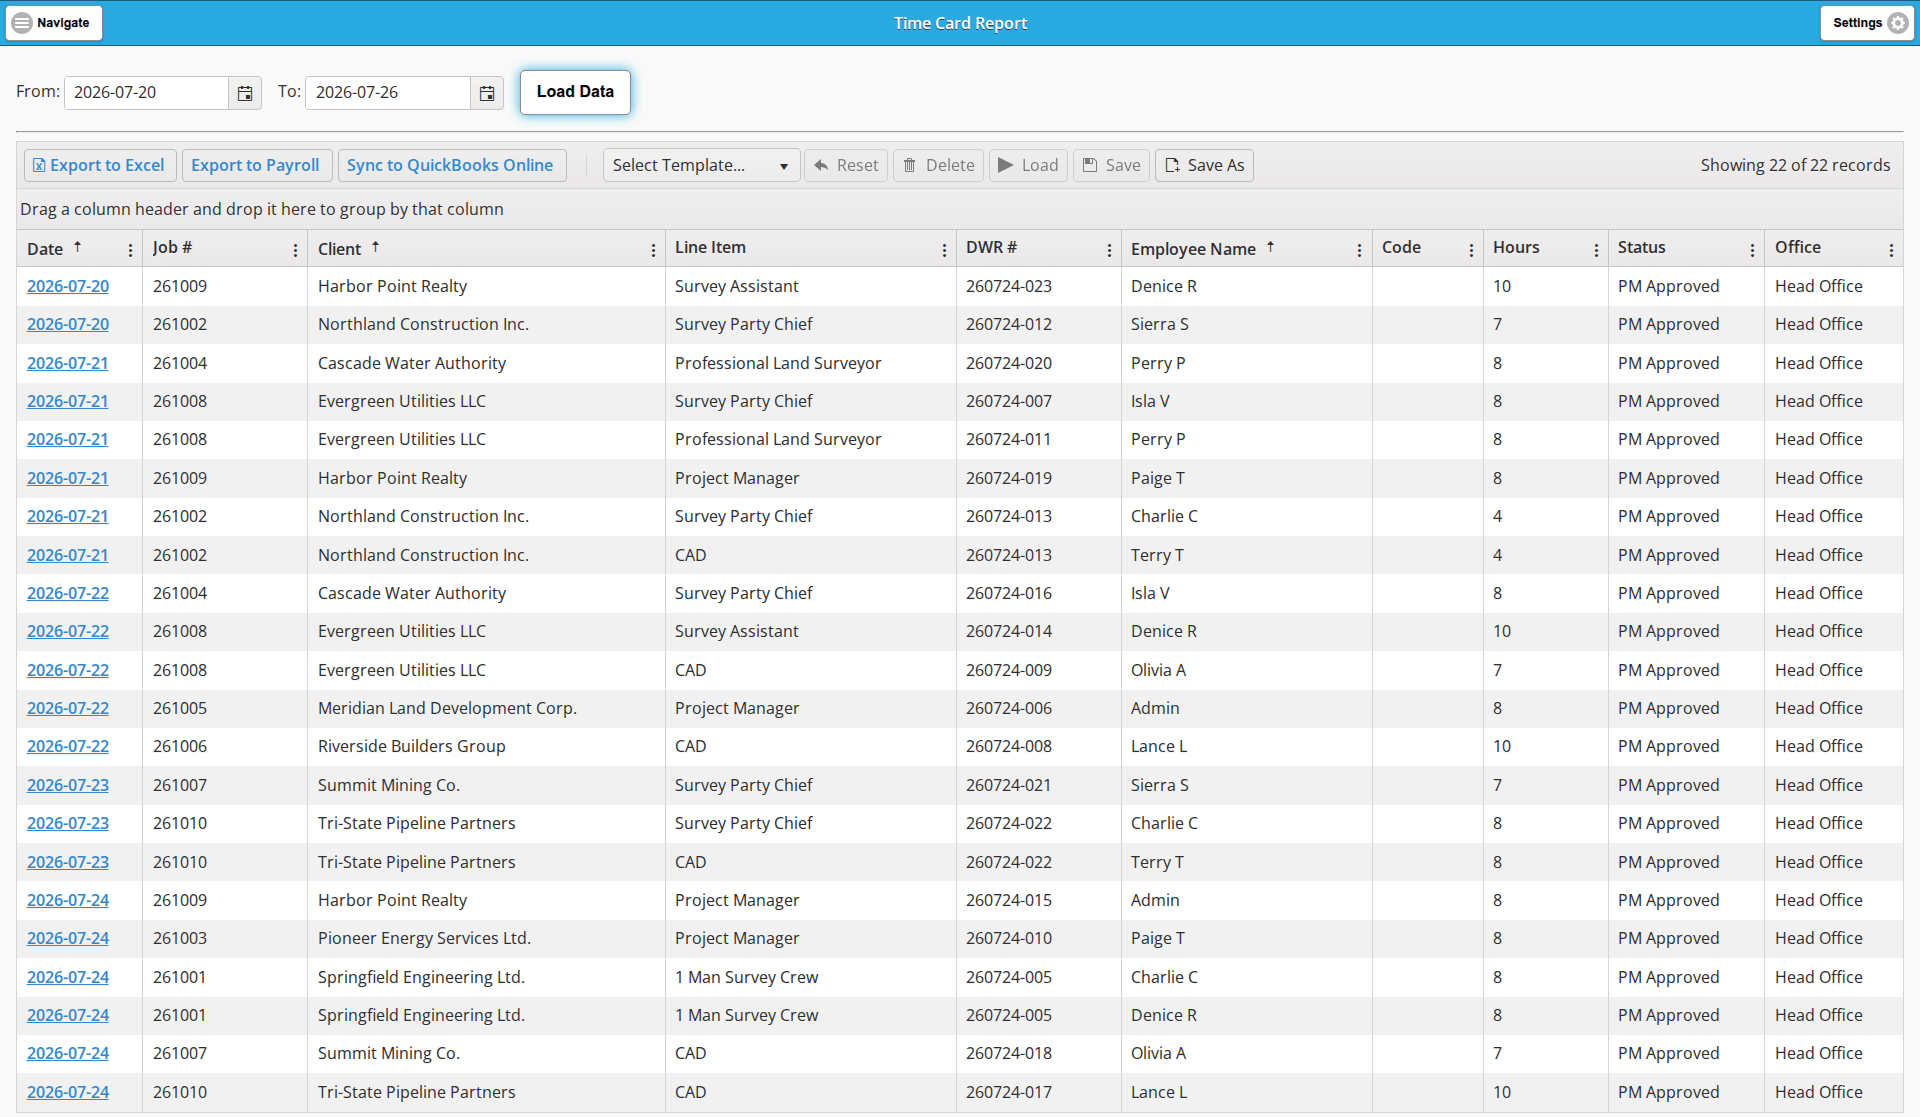
The Time Card Report shows labour hours and can be exported to Excel for payroll.
There is one row for every labour line on a Daily Work Record (DWR), so an employee who worked on three jobs in a day has three rows. The columns are Date, Job #, Client, Line Item, DWR #, Employee Name, Code, Hours, Status and Office. The Date in each row is a link that opens the DWR the line came from in a new browser tab. Status is that DWR’s status, so a row reading PM Approved is time the job’s project manager has already approved. Office is the job’s office, not the employee’s. The report opens sorted by Date, then Client, then Employee Name.
The Time Card Report is the only one of the four with buttons beyond Export to Excel: Export to Payroll and Sync to QuickBooks Online.
Time Grid
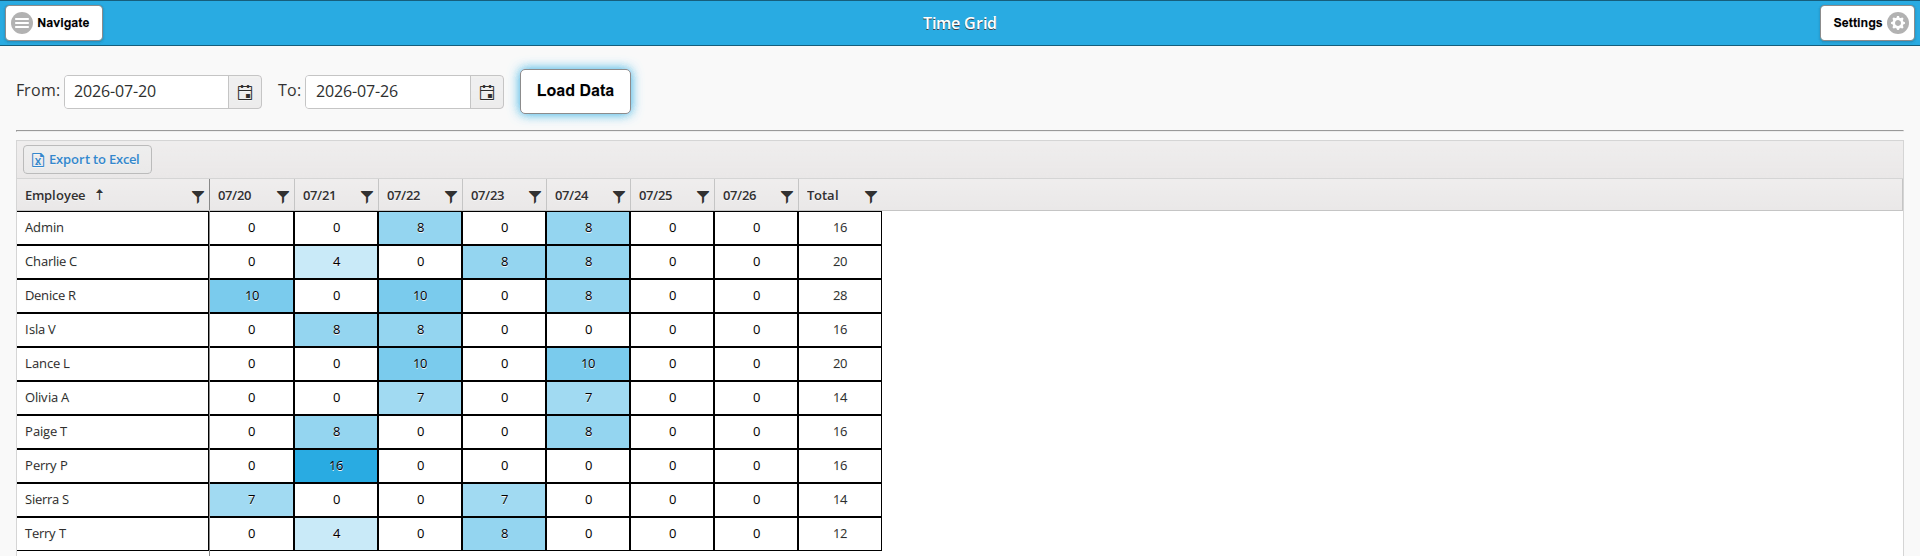
The Time Grid totals hours per employee.
It is a matrix rather than a list: one row per employee, one column for each day in the range, and a Total column at the end. Reading across a row shows you a day someone forgot to fill in, or a day with more hours on it than anyone worked. The range is a month at most: set a longer one and Load Data goes grey with the message “Please specify a time range of 1 month or less.”
Utilization Report
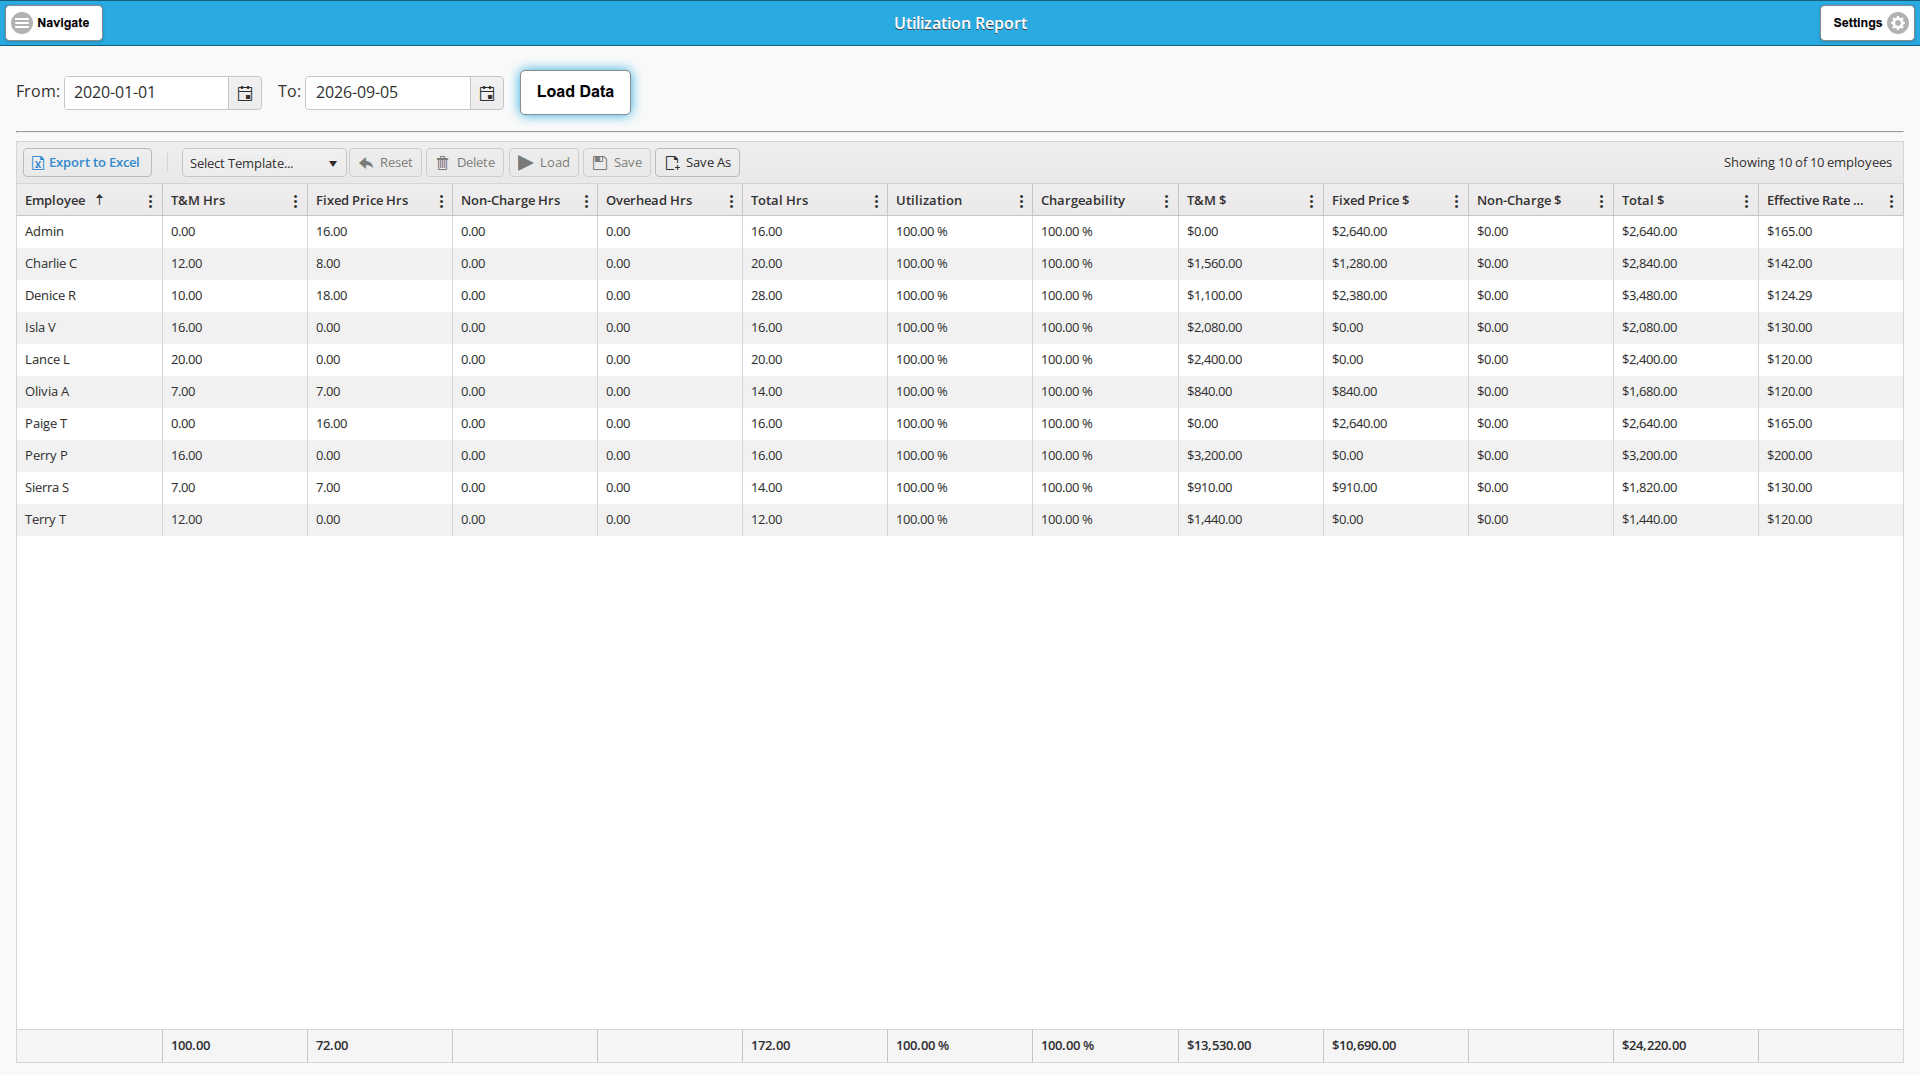
The Utilization Report shows utilization, chargeability, and effective rate of your staff.
There is one row per employee. The columns to start with (Office is there too, hidden until you turn it on from the column menu):
- Employee: the person the row is about.
- T&M Hrs, Fixed Price Hrs, Non-Charge Hrs and Overhead Hrs: the employee’s hours split into the four categories.
- Total Hrs: those four added together.
- Utilization: T&M Hrs, Fixed Price Hrs and Non-Charge Hrs added together, as a percentage of Total Hrs.
- Chargeability: T&M Hrs and Fixed Price Hrs added together, as a percentage of Total Hrs less Overhead Hrs.
- T&M $, Fixed Price $ and Non-Charge $: what those hours came to at their billing rates, the only rates Job Book holds.
- Total $: the three dollar columns added together.
- Effective Rate $/hr: Total $ divided by Total Hrs.
A totals row runs across the bottom of the grid.
Expense Report
The Expense Report lists all expenses and their status.
There is one row per expense, with the columns Expense Date, Submitted Date, Job #, Client, Expense Item, Employee Name, Amount, Status and Description. A Total of the Amount column sits at the foot of the grid, so you can read a period’s spend without exporting anything. The Expense Date in each row is a link that opens the expense in a new browser tab. The report opens sorted by Expense Date, then Employee Name.
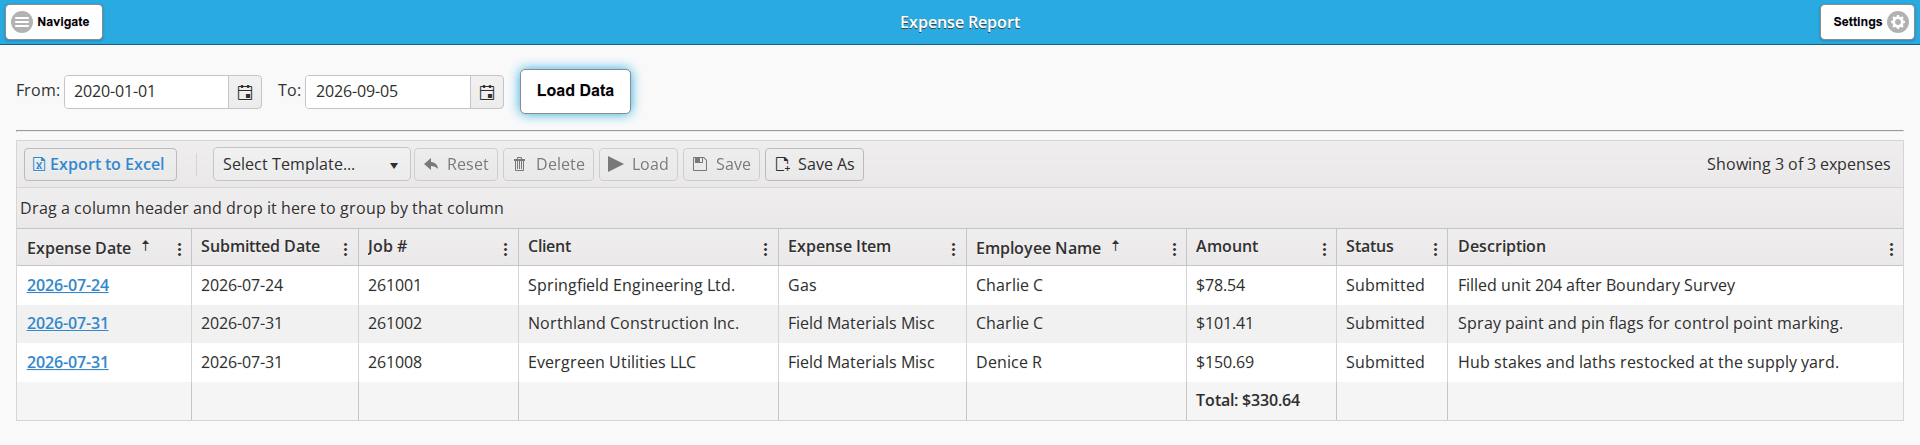
Status tells you where the expense has got to. Submitted means the employee has sent it in and it is waiting in the Expense Approval Backlog.
Last updated