Task Dashboard
Overview
The Task Dashboard is your central hub for keeping track of all important tasks. It gives you a clear, up-to-the-minute view of everything that needs attention. To keep things tidy, the dashboard only shows you the tasks that are currently relevant. This includes:
- Any task that hasn’t been marked as ‘Completed’.
- Tasks scheduled for a future date.
- All tasks from a project (‘Task Plan’) that is still in progress.
Accessing the Task Dashboard
You can get to the Task Dashboard right from your main dashboard. Just look for the ‘Tasks / Scheduling’ card and click on ‘Task Dashboard’.
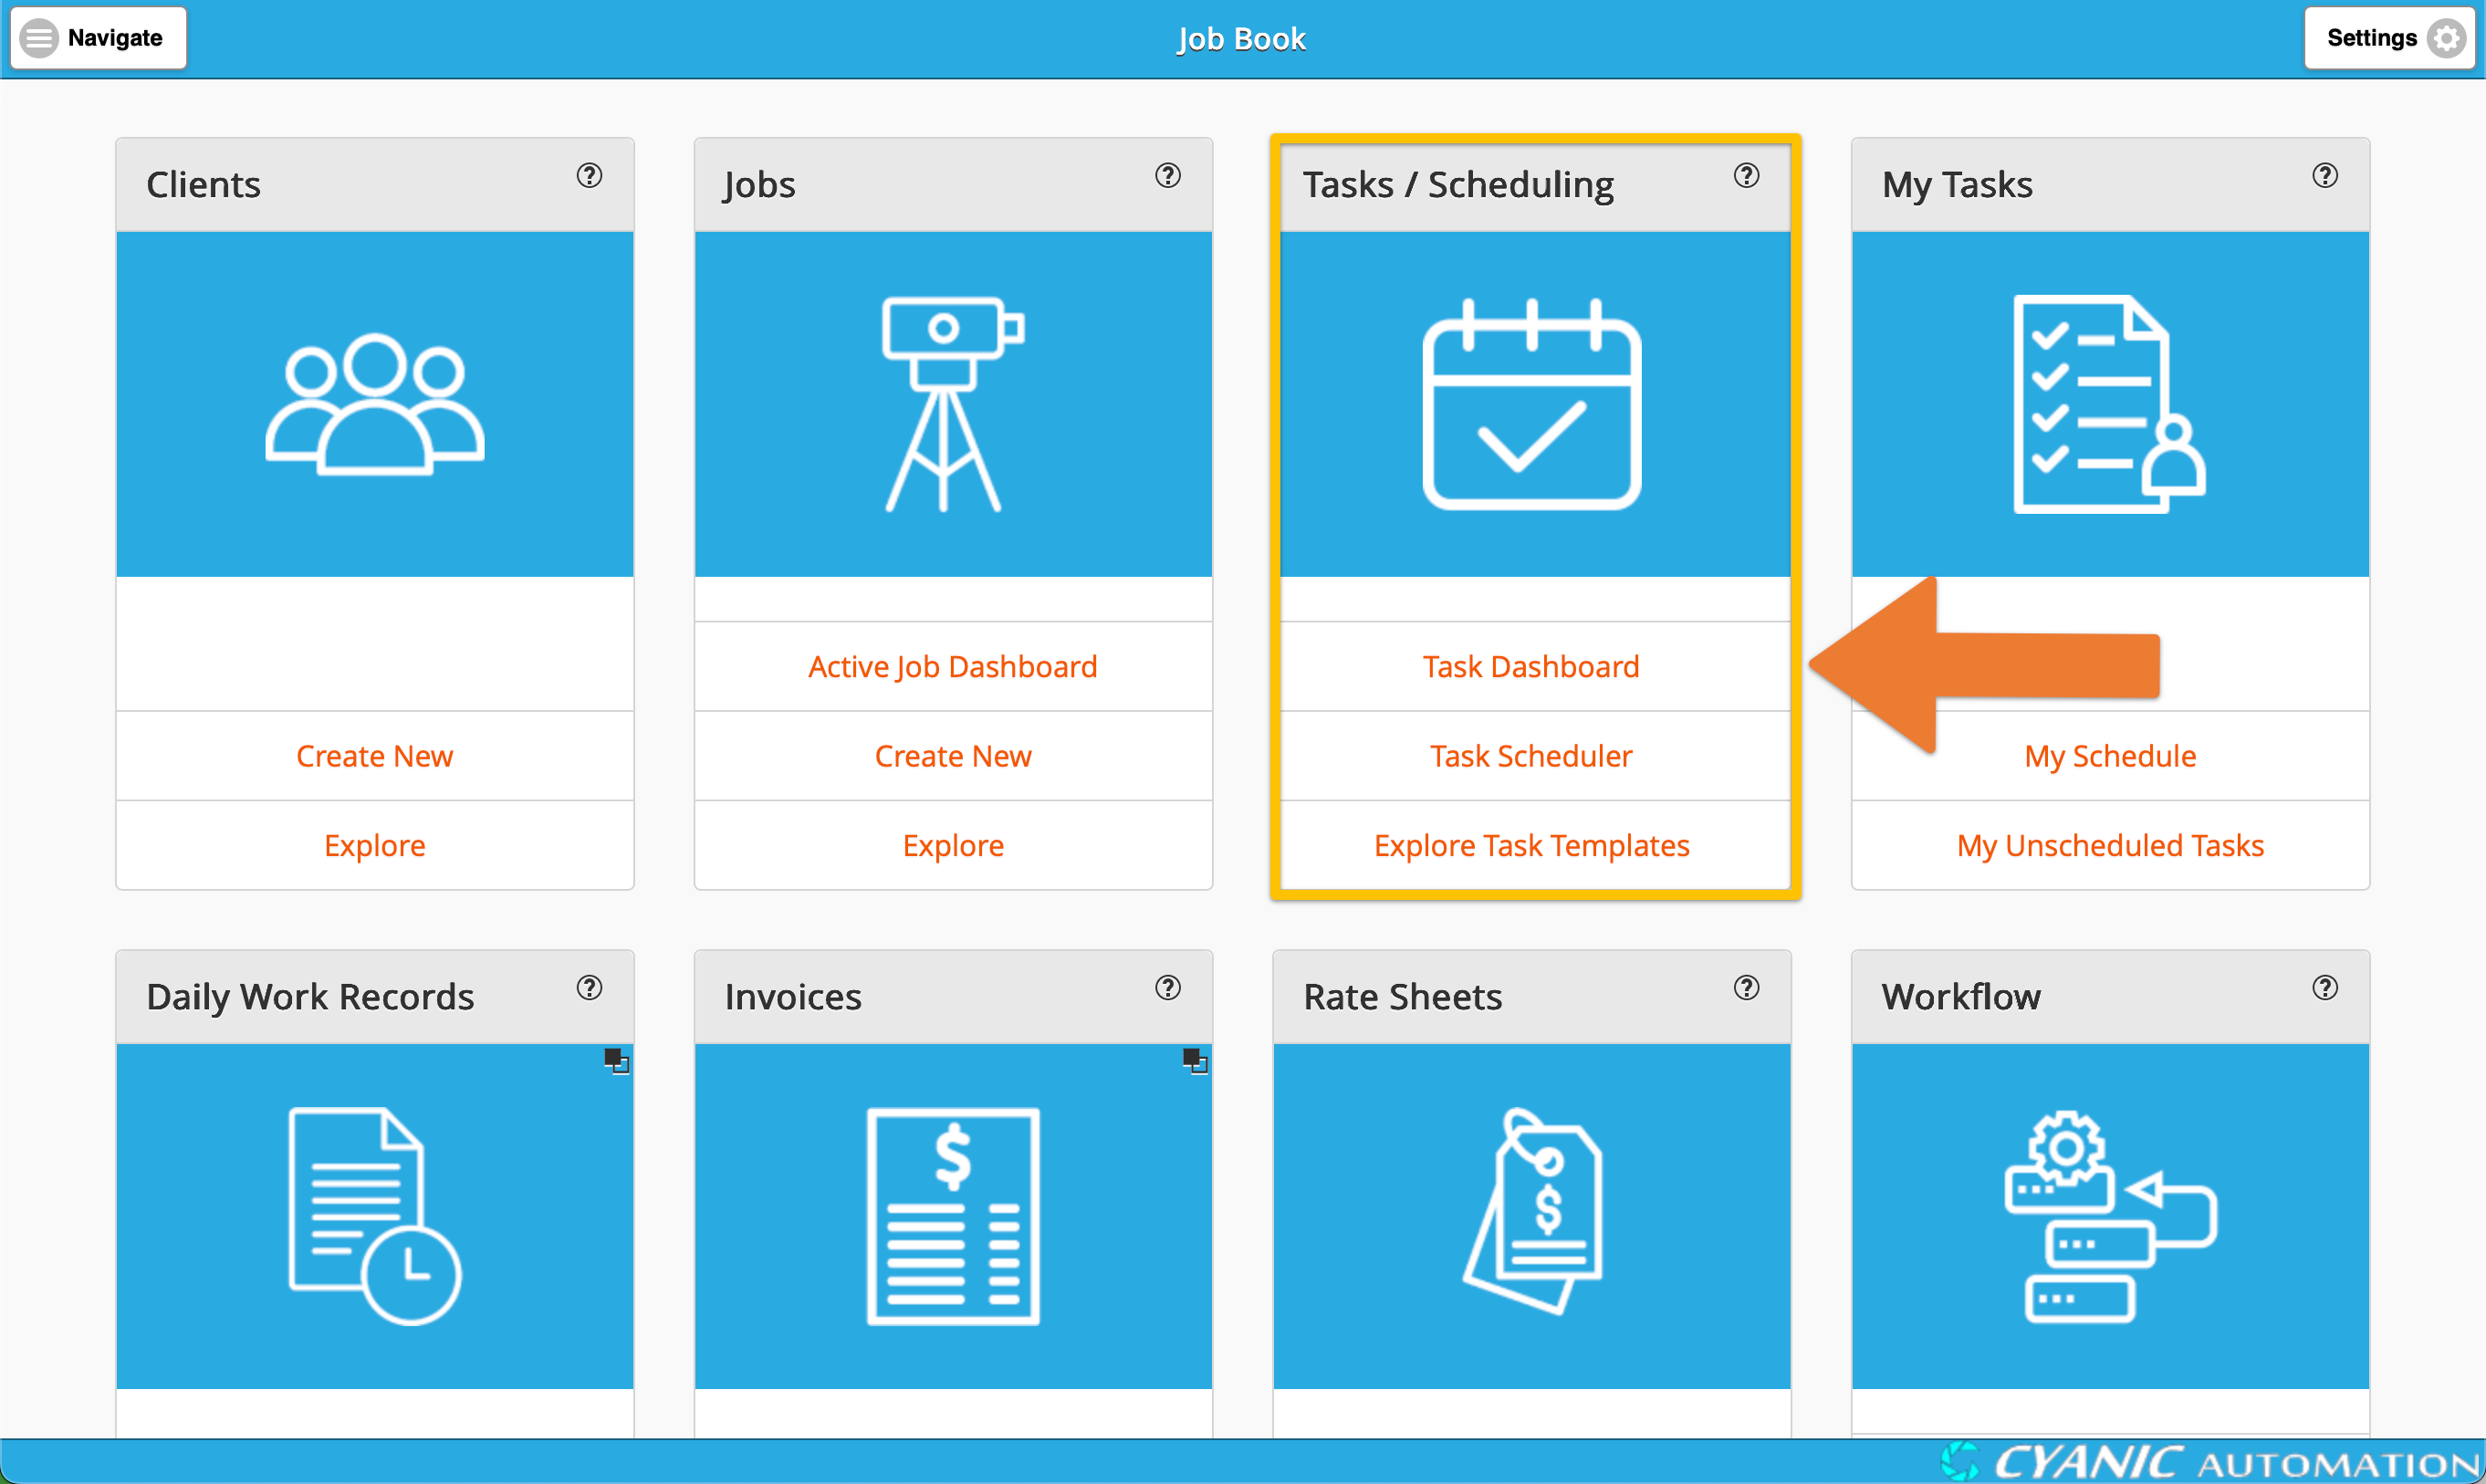
After clicking, you’ll be taken to the main Task Dashboard. It provides a comprehensive grid view of all your relevant tasks, allowing you to quickly see what’s on your plate.
Features
The Task Dashboard is designed to be flexible and powerful, giving you the information you need in the way you want to see it. Here’s a breakdown of what you can do:
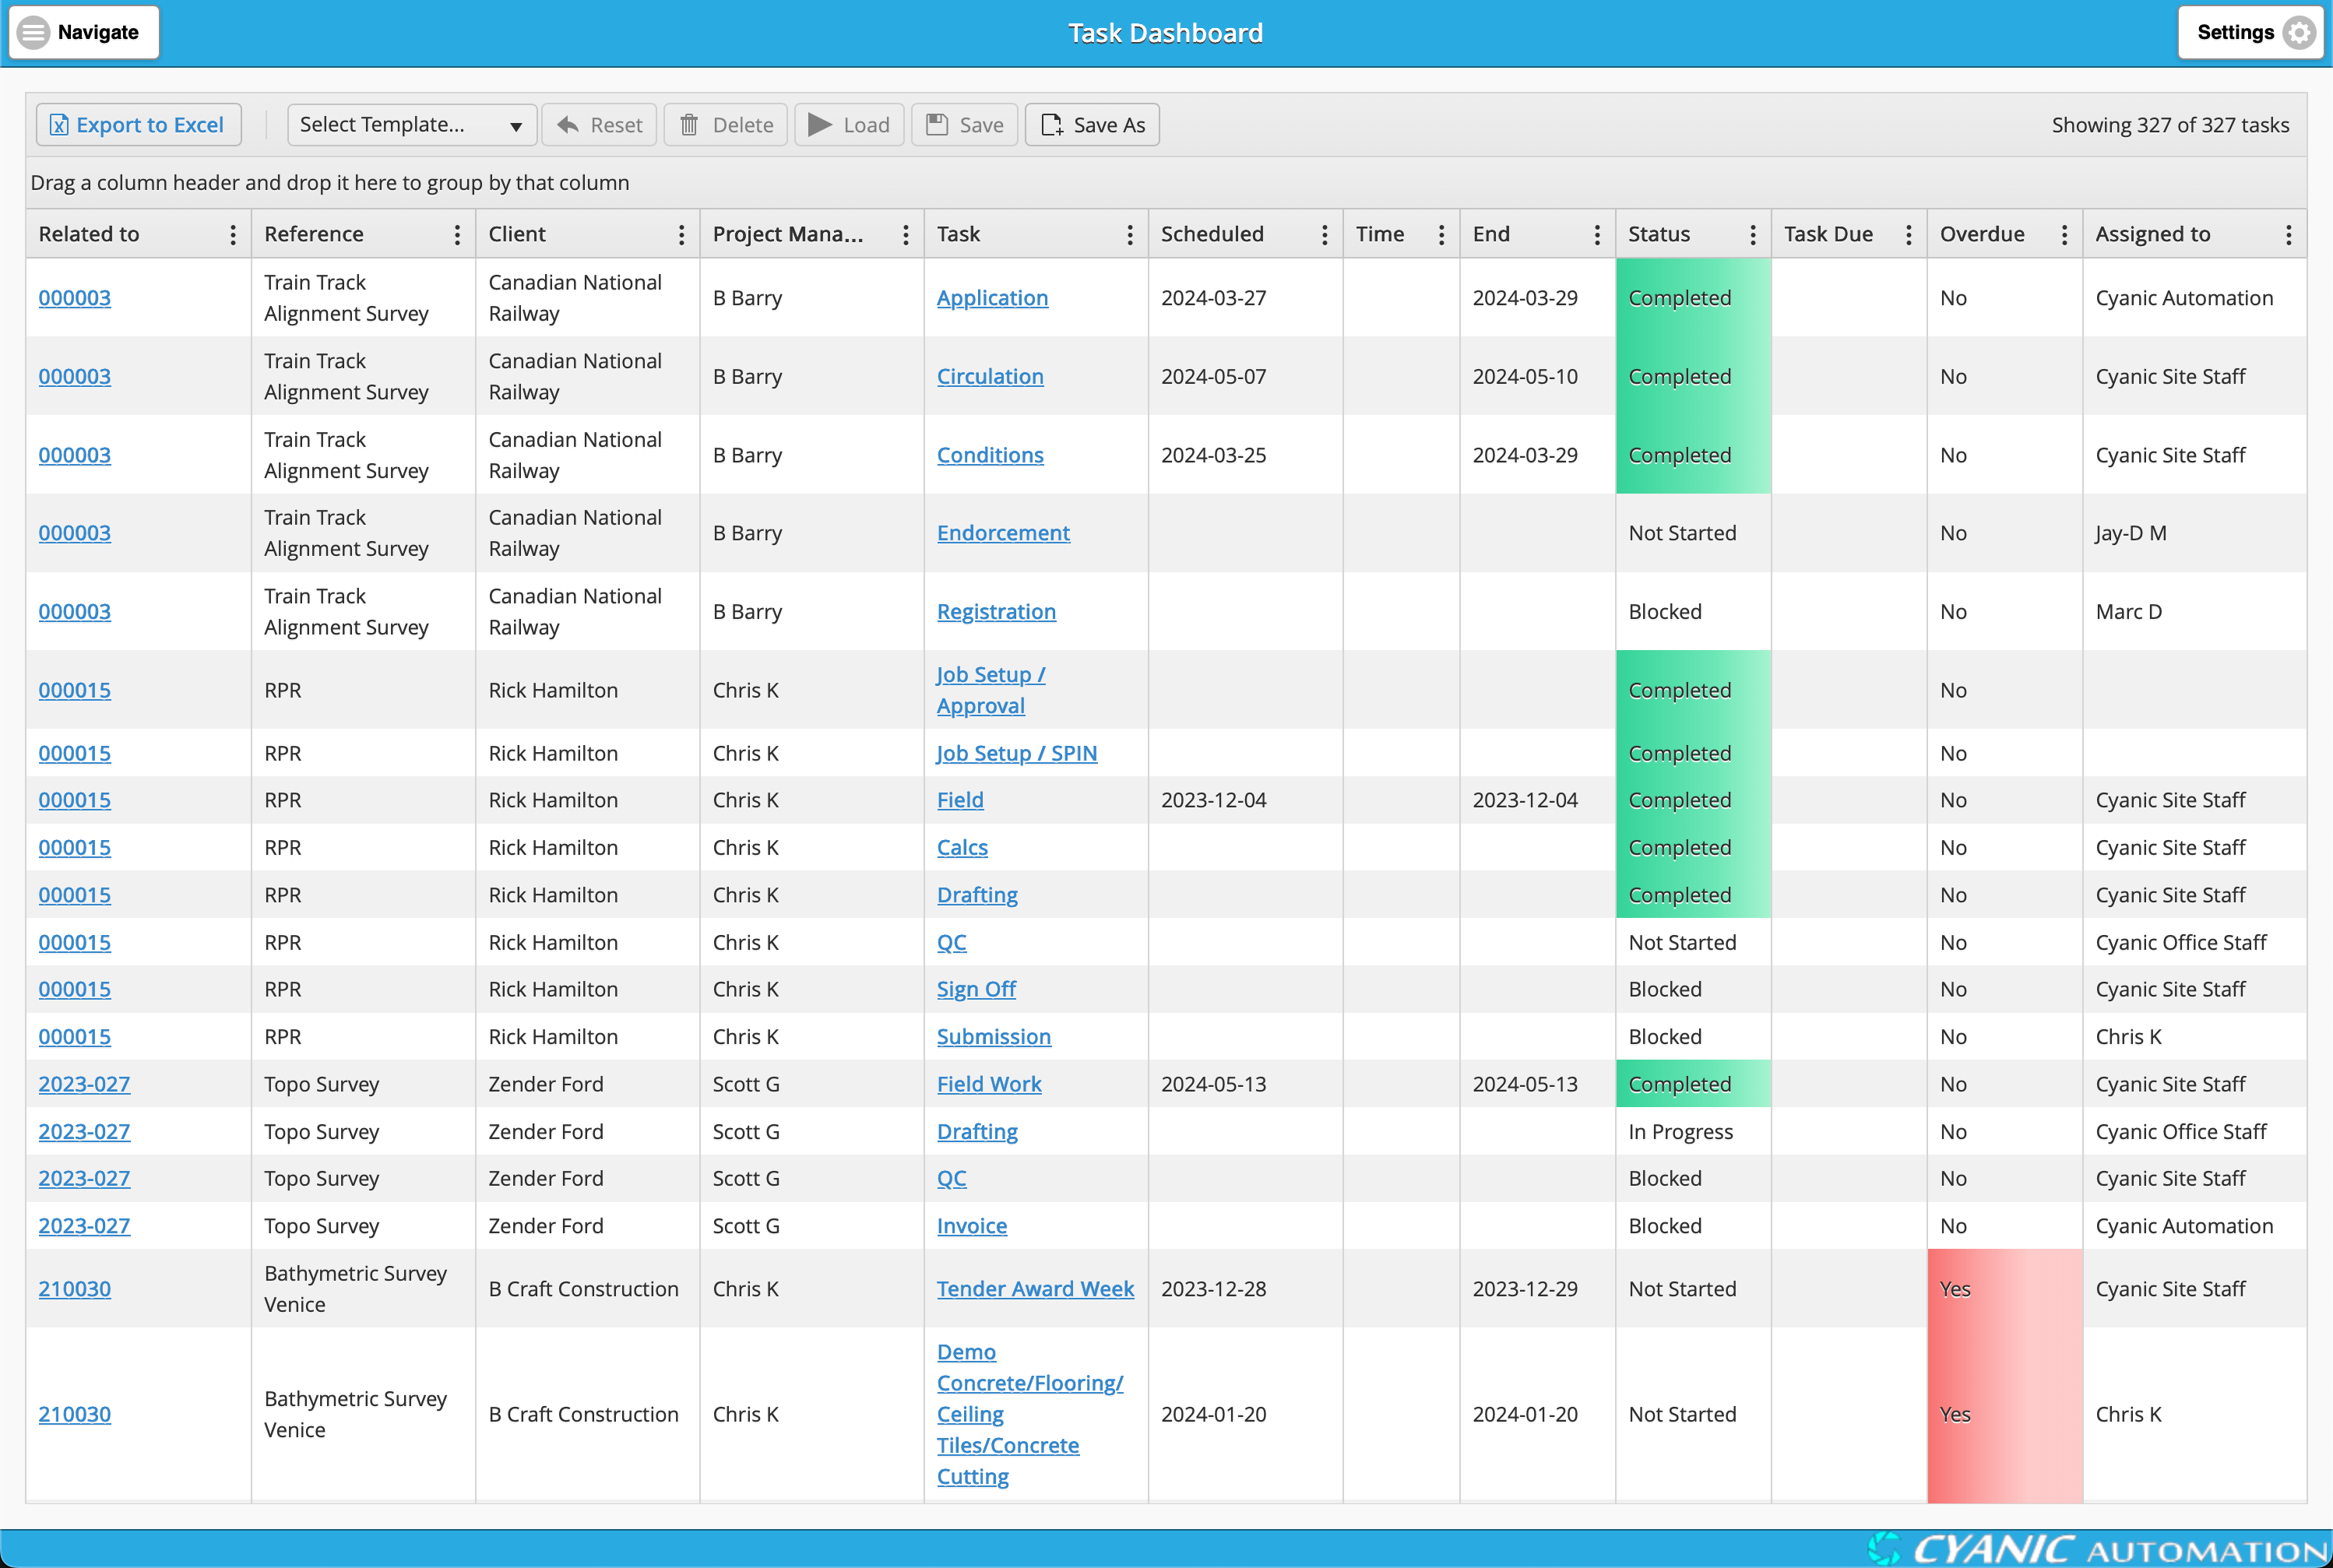
Understanding the Columns
The dashboard is organized into several columns to give you all the details you need at a glance:
- Related to: This is the job number. You can click on it to jump directly to that job’s page.
- Reference: The name of the project the task is a part of.
- Client: The client for the job.
- Project Manager: The person in charge of the job.
- Task: The name of the task. Clicking on this will take you to the detailed Task Plan.
- Scheduled: The date the task is scheduled to begin.
- Time: The specific start time for the task, if one has been set.
- End: The date the task is scheduled to be completed.
- Status: This tells you the current state of the task:
- Not Started: The task is waiting to be started.
- In Progress: The task is currently being worked on.
- Completed: The task is finished. The cell will be highlighted in green for easy identification.
- Blocked: A special status indicating that the task can’t be started yet because other tasks it depends on are not complete.
- Task Due: The deadline for the task.
- Overdue: This will show ‘Yes’ if the task is past its due date but not yet completed. The cell will be highlighted in red to draw your attention.
- Assigned to: The person responsible for completing the task.
- Office: This column is hidden by default, but you can show it by clicking the three vertical dots icon in any column header and selecting it from the menu.
Customizing Your View
The Task Dashboard is built on a powerful grid system that lets you customize the layout to fit your needs. You can:
- Export to Excel: Click the button in the toolbar to download your current view as an Excel spreadsheet.
- Sort: Click on any column header to sort the entire table by that column. Click again to reverse the sort order. You can also perform multi-column sorting by clicking on additional column headers. Each click will add or change the sort order for that column, and previous sorts will be maintained. For example, you can sort by ‘Project Manager’ first, and then by ‘Task Due’ date within each project manager’s tasks. The order in which you click the headers determines the sorting priority.
- Show/Hide Columns: Click the three vertical dots icon in the right-hand side of each column header to open the column menu, then choose which columns you want to see or hide.
- Filter: The column menu also lets you filter the tasks based on specific criteria, so you can focus on what’s most important.
- Group: Drag a column header to the area above the table to group your tasks by that column.
- Reorder and Resize Columns: Drag and drop the column headers to rearrange them, or drag the edge of a column to resize it.
Saving and Applying Your Layouts (Report Templating)
The Task Dashboard supports Job Book’s powerful Report Templating feature. This allows you to save your customized grid layouts and apply them later, saving you time and ensuring consistent reporting. This feature enhances the standard grid with extra controls in the grid toolbar.
What can you save in a template?
When you save a template, it captures the following aspects of your current Task Dashboard view:
- Visible columns: Which columns are shown or hidden.
- Column widths: The size of each column.
- Filters: Any filters you’ve applied to narrow down your tasks.
- Sorting: The primary and secondary sort orders applied to your data.
- Grouping: How your tasks are grouped by specific columns.
How to use Report Templating:
Save a new template: To save your current grid configuration as a new template:
- Click the ‘Save As’ button in the toolbar.
- Enter a descriptive name for your template.
- Click ‘OK’.
Replace an existing template: To update a previously saved template with your current grid configuration:
- Select the template you wish to update from the ‘Select Template…’ dropdown in the toolbar.
- Click the ‘Save’ button.
- Confirm your action by clicking ‘OK’ on the confirmation dialog.
Load a saved template: To apply a saved template to your current view:
- Select the template you want to load from the ‘Select Template…’ dropdown.
- Click the ‘Load’ button.
Delete a saved template: To remove a template you no longer need:
- Select the template from the ‘Select Template…’ dropdown.
- Click the ‘Delete’ button.
- Confirm your action by clicking ‘OK’ on the confirmation dialog.
Reset to default: To clear all custom settings and return the grid to its original default configuration:
- Click the ‘Reset’ button in the toolbar.
This feature is incredibly useful for frequently used reports, offering a convenient way to save your personalized views for quick access. Your templates are stored securely in your browser for your individual use.